A Supply Point is the physical point at which consumption of a commodity is metered for billing purposes (e.g. ICP for electricity or gas).
An account may be associated with a number of supply points over time and vice versa. The supply points (ICPs) page allows supply points details to be used, as an alternative to account Id, for accessing cost and consumption data.
Data filtered by a supply point may contain history stretching back over several accounts, possibly with more than one supplier. Charts and tables for supply points are more likely to span longer historical periods than would be the case if only the account was selected.
Monthly Consumption vs Cost - Energy (default)
| Object type
|
- Double Y-axis chart
|
| Purpose
|
- To compare how normalised monthly consumption tracks against cost over a period for one or more sites. Nearly all graph features can be configured in-session, allowing the page to be used for supply points of any commodity.
|
| Defaults
|
|
- Reporting interval
|
- Monthly Totals
|
- Plot type
|
- Bar and line
|
- Dates
|
- Relative
|
- Start date
|
- Current year -3
|
- End date
|
- Current month
|
| Configurable in session
|
- Start date
|
- End date
|
- Graph type
|
- Y1 axis 1 variable
|
- Y1 axis 1 plot type
|
- Y1 axis 2 variable
|
- Y1 axis 2 plot type
|
Monthly Budgeted vs Projected Usgae - Energy (default)
| Object type
|
- Unit chart
|
| Purpose
|
- To highlight variance between budgeted and projected consumption profiles for one or more sites.
|
| Defaults
|
|
- Reporting interval
|
- Monthly
|
- Plot type
|
- Line
|
- Dates
|
- Relative
|
- Start date
|
- Current year -4
|
- End date
|
- Current month +18
|
| Configurable in session
|
- Start date
|
- End date
|
- Graph type
|
- Units
|
- Monthly Value Types
|
- Plot Type
|
Supply Point Browser
| Object type
|
- Supply Point List
|
| Purpose
|
- To provide fast access to details for all Accounts with associated with a supply point (ICP).
|
| Defaults
|
|
- Reporting interval
|
- Last 12 months
|
- Dates
|
- Relative
|
- Start date
|
- Current year -1
|
- End date
|
- Current month
|
| Configurable in session
|
- Start date
|
- End date
|
| Feature
|
Description
|
- Number of Entries Selector
|
- Selects how many supply points entries will appear in the object (a vertical scroll bar will appear when more entries than can fit in the control are selected).
|
- Off-Screen Entry Selector
|
- A set of numbered buttons, reach representing a sub-page containing the selected number of currently off-screen supply point entries.
|
- Connection Search
|
- Allows the current set of supply point entries to be filtered by a search string. Search takes place across all fields in the supply point line and is applied with each character is typed.
|
- Count of Entries
|
- Shows a count of the individual supply points currently accessible (this count is updated as searches are applied.
|
- Sortable Columns
|
- All columns with a pale grey double headed arrow on the right margin of the column header cell are sortable. A single click anywhere in the column cell sorts the whole supply point list in ascending order by the contents of the column. A second click re-sorts in descending order. The list can only be sorted by one column at a time. Currently applied sorts are indicated by replacing the grey double headed arrows with a single dark grey arrow head (down for descending order, up for ascending order).
|
- Connection Selection
|
- Clicking anywhere in a row in the supply point list (which will be highlighted as the mouse moves over it) will cause the individual supply point to be applied in the filter. This causes all pages in the data section to display only data related to that supply point.
|
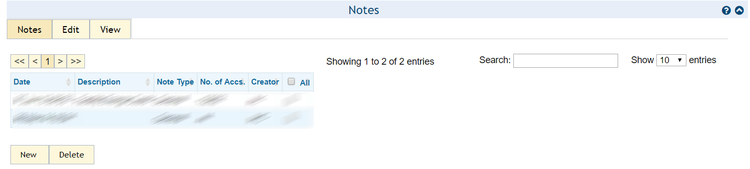
Notes Browser
| Object type
|
- Notes browser
|
| Purpose
|
- To allow viewing and editing of notes (e.g. meter notes) associated with the supply point.
|
| Configurable in session
|
- None
|


