| Settings
|
Description
|
Values
|
- Title
|
- Graph display title
|
- Custom
|
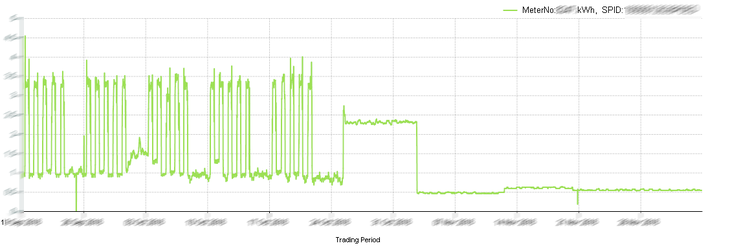
- Graph type
|
- Determines the type of chart displayed
|
- Single Y-Axis
|
- Graph value type
|
- Determines if point values are charted singly or cumulatively
|
|
- Wrap type
|
- Determines if values are charted continuously or wrapped buy financial year
|
|
- Height
|
- Determines the vertical height (in pixels) of the chart on the rendered web page
|
- Custom
|
- Y-Axis value type
|
- Value to be charted
|
- All time series data values
|
- Y-Axis plot type
|
- Determines the on-screen appearance of the data plot
|
|
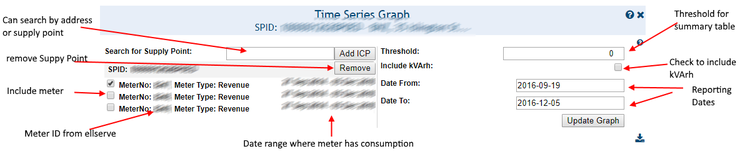
- Date range
|
- Reporting time period
|
- Date range from date picker
|