Difference between revisions of "Time Of Use Graph"
Jump to navigation
Jump to search
| Line 6: | Line 6: | ||
|- | |- | ||
| | | | ||
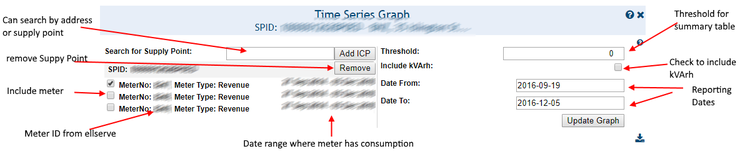
| − | :''' | + | :'''Search for Supply Point''' |
| | | | ||
| − | : | + | :Allows a user to search for supply points based on SupplyPoint or address and add it to the list |
| | | | ||
| − | : | + | :Supply Points |
|- | |- | ||
| | | | ||
Revision as of 08:33, 20 September 2017

| Settings | Description | Values |
|---|---|---|
|
|
|
|
|
|
|
|
|
|
|
|
|
|
|
|
||
|
|
|
|
|


