Difference between revisions of "Data Table"
Jump to navigation
Jump to search
(→Usage) |
(→Usage) |
||
| Line 54: | Line 54: | ||
---- | ---- | ||
[[Main Page | <span style="font-family:webdings">4</span>Main Page]] | [[Main Page | <span style="font-family:webdings">4</span>Main Page]] | ||
| + | [[Guide to Ellserve | <span style="font-family:webdings">4</span>Guide to Ellserve]] | ||
[[Data Browser| <span style="font-family:webdings">4</span>Data Browser]] | [[Data Browser| <span style="font-family:webdings">4</span>Data Browser]] | ||
[[Data Page| <span style="font-family:webdings">4</span>Data Page]] | [[Data Page| <span style="font-family:webdings">4</span>Data Page]] | ||
[[Display Controls| <span style="font-family:webdings">4</span>Display Controls]] | [[Display Controls| <span style="font-family:webdings">4</span>Display Controls]] | ||
Revision as of 09:45, 19 June 2014
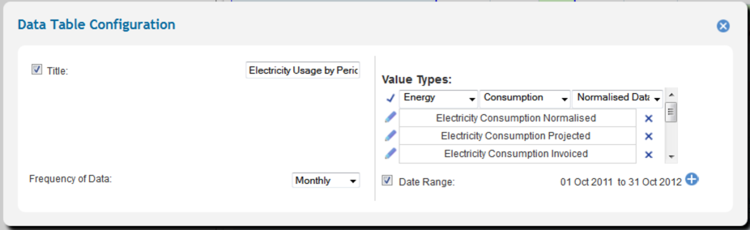
Configuration

| Purpose |
|
|---|---|
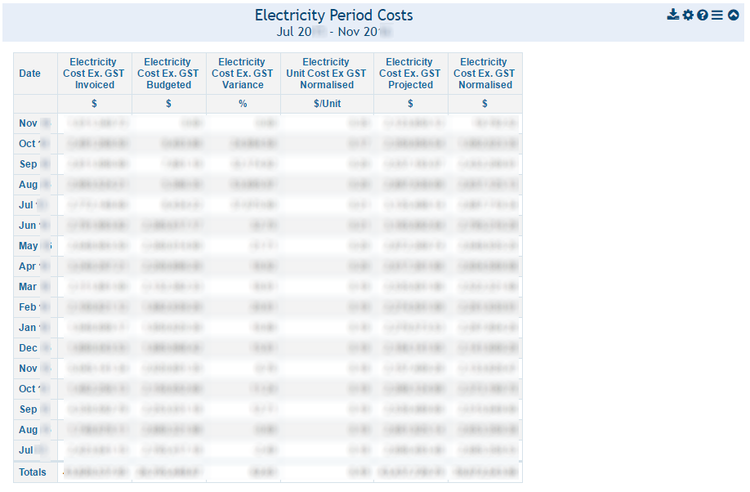
| Example |
|

| Settings | Description | Values |
|---|---|---|
|
| |
|
|
|
|
||
|
|
Usage
The data table has no interactive usage features.
4Main Page 4Guide to Ellserve 4Data Browser 4Data Page 4Display Controls