Difference between revisions of "Home Page"
Jump to navigation
Jump to search

Paul Chapman (talk | contribs) |
|||
| Line 1: | Line 1: | ||
| − | |||
The home page provides an overview of consumption trends for major commodity groups. | The home page provides an overview of consumption trends for major commodity groups. | ||
| Line 7: | Line 6: | ||
===Controls=== | ===Controls=== | ||
The home page contains an annualised cumulative consumption chart for <u>each</u> main commodity group. | The home page contains an annualised cumulative consumption chart for <u>each</u> main commodity group. | ||
| + | |||
| + | [[File:Home1.png|right|750px|Frame|Annualised Usage Trend - Energy Commodity Group]] | ||
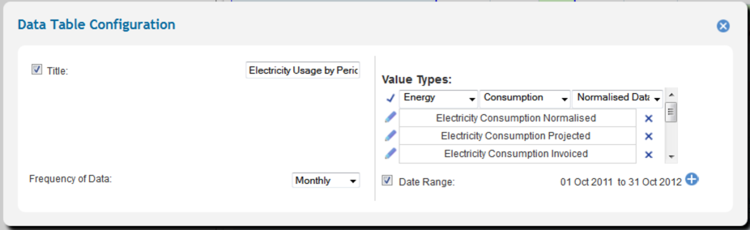
[[File:Table1.png|right|750px|Frame|Data Table Configuration Panel]] | [[File:Table1.png|right|750px|Frame|Data Table Configuration Panel]] | ||
Revision as of 16:30, 13 June 2014
The home page provides an overview of consumption trends for major commodity groups.
Note: The home page is designed to load quickly when launching Ellserve.
This allows filters to be applied before attempting to display large data sets in the data section.
Controls
The home page contains an annualised cumulative consumption chart for each main commodity group.


| Object Type | |
|---|---|
| Purpose |
|
| Defaults | |
|---|---|
| Reporting Interval |
|
| Plot Type |
|
| Dates |
|
| Start Date |
|
| End Date |
|
| Configurable in session |
|---|
|