Difference between revisions of "Time Of Use Graph"
Jump to navigation
Jump to search
| Line 44: | Line 44: | ||
|} | |} | ||
| − | + | ''Note: The confiuration is for the whole page | |
| − | Note: The confiuration is for the whole page | ||
| − | |||
== HHD Graph == | == HHD Graph == | ||
Revision as of 08:42, 20 September 2017
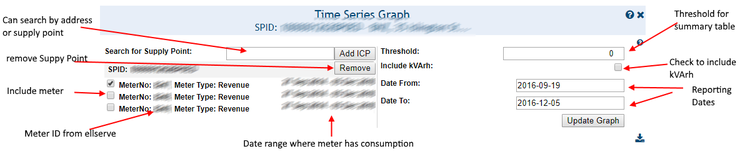
Confirguration

| Settings | Description | Values |
|---|---|---|
|
|
|
|
|
|
|
|
|
|
|
|
|
|
|
Note: The confiuration is for the whole page
HHD Graph

| Purpose |
|
|---|---|
| Example |
|

