Difference between revisions of "Time Of Use Graph"
Jump to navigation
Jump to search
| (40 intermediate revisions by the same user not shown) | |||
| Line 1: | Line 1: | ||
| − | == | + | ==Confirguration== |
[[File:TOU1.PNG|right|750px|Frame|Data Table Configuration Panel]] | [[File:TOU1.PNG|right|750px|Frame|Data Table Configuration Panel]] | ||
| − | + | ||
| − | |||
| − | |||
| − | |||
| − | |||
| − | |||
| − | |||
| − | |||
| − | |||
| − | |||
{|class="wikitable" style="text-align: left; color: black;" | {|class="wikitable" style="text-align: left; color: black;" | ||
! Width="150" Align="Center"|'''Settings''' | ! Width="150" Align="Center"|'''Settings''' | ||
| Line 17: | Line 8: | ||
|- | |- | ||
| | | | ||
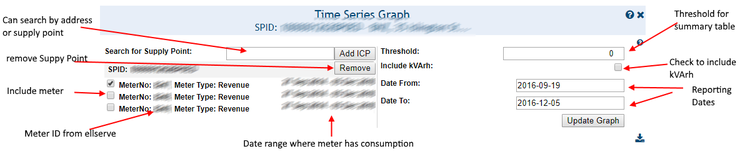
| − | :''' | + | :'''Search for Supply Point''' |
| + | | | ||
| + | :Allows a user to search for supply points based on SupplyPoint or address and add it to the list | ||
| + | | | ||
| + | :Supply Points | ||
| + | |- | ||
| + | | | ||
| + | :'''Threshold''' | ||
| | | | ||
| − | : | + | : Sets the threshold kWh for the summary table which the user would like a count and % off |
| | | | ||
| − | : | + | :Real |
|- | |- | ||
| | | | ||
| − | :''' | + | :'''Include kVArh''' |
| | | | ||
| − | : | + | : Adds a seperate line per meter in the main graph for kVArh when checked |
| | | | ||
| − | :* | + | :* Checked |
| − | :* | + | :* Unchecked |
| − | |||
| − | |||
|- | |- | ||
| | | | ||
| − | :''' | + | :'''Date From''' |
| | | | ||
| − | : | + | : Determines the date when you would like to report from |
| | | | ||
| − | : | + | :Date |
|- | |- | ||
| | | | ||
| − | :'''Date | + | :'''Date To''' |
| + | | | ||
| + | : Determines the date when you would like to report to | ||
| + | | | ||
| + | : Date | ||
| + | |} | ||
| + | |||
| + | ''Note: The configuration is for the whole page | ||
| + | |||
| + | == HHD Graph == | ||
| + | [[File:TOU2.PNG|right|750px|Frame|Data Table Display]] | ||
| + | {| class="wikitable" style="text-align: left; color: black;" | ||
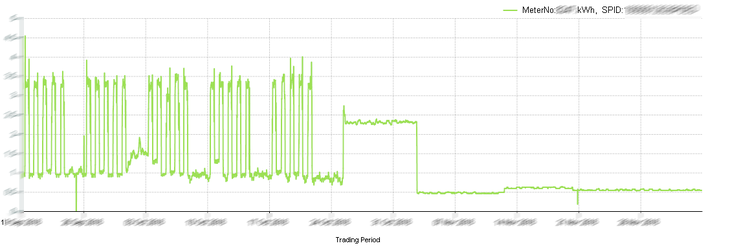
| + | !Width="100" Align="Center"|'''Purpose ''' | ||
| | | | ||
| − | : | + | :To chart the selected meters half hourly data |
| + | |- | ||
| + | !'''Example ''' | ||
| + | | | ||
| + | :To chart the selected meters for a single supply point for the last year for kWh and kVArh | ||
| + | |} | ||
| + | |||
| + | <br> | ||
| + | <br> | ||
| + | <br> | ||
| + | <br> | ||
| + | <br> | ||
| + | <br> | ||
| + | <br> | ||
| + | <br> | ||
| + | <br> | ||
| + | |||
| + | == Summary Table == | ||
| + | [[File:TOU3.PNG|right|750px|Frame|Data Table Display]] | ||
| + | |||
| + | {| class="wikitable" style="text-align: left; color: black;" | ||
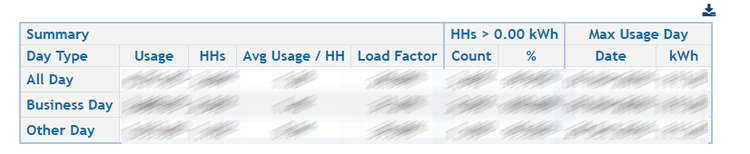
| + | !Width="100" Align="Center"|'''Purpose ''' | ||
| + | | | ||
| + | :To show a summary count and usage of trading periods over the day types: All Day, Business Day, Other Day | ||
| + | |} | ||
| + | |||
| + | <br> | ||
| + | <br> | ||
| + | <br> | ||
| + | <br> | ||
| + | <br> | ||
| + | <br> | ||
| + | |||
| + | == Average profiles == | ||
| + | [[File:TOU4.PNG|right|750px|Frame|Data Table Display]] | ||
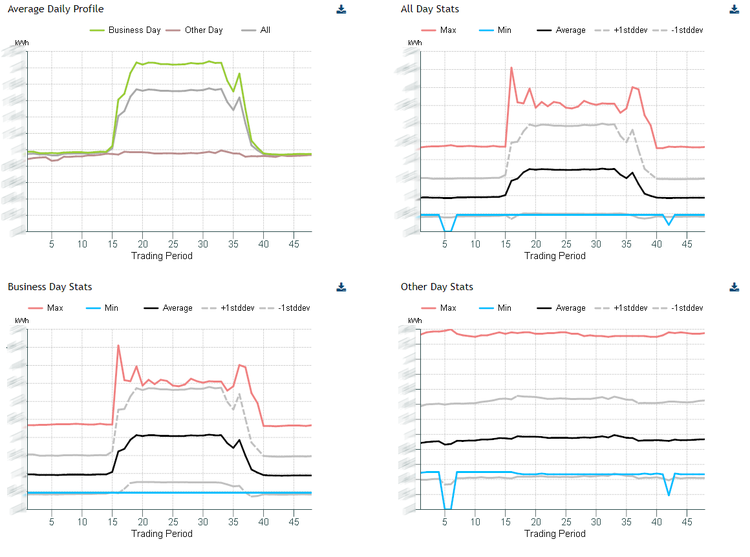
| + | ''Purpose: Charts the average usage over a day | ||
| + | {| class="wikitable" style="text-align: left; color: black;" | ||
| + | !Width="200" Align="Center"|'''Average daily profile ''' | ||
| + | | | ||
| + | :Split by All Day, Business Day and Other Day | ||
| + | |- | ||
| + | !Width="200" Align="Center"|'''All Day Stats ''' | ||
| + | | | ||
| + | :All the usage split by Max, Min, Average, +1 standard deviation, -1 standard deviation | ||
| + | |- | ||
| + | !Width="200" Align="Center"|'''Business Day Stats''' | ||
| + | | | ||
| + | :Business day usage split by Max, Min, Average, +1 standard deviation, -1 standard deviation | ||
| + | |- | ||
| + | !Width="200" Align="Center"|'''Other Day Stats''' | ||
| | | | ||
| − | : | + | :Other day usage split by Max, Min, Average, +1 standard deviation, -1 standard deviation |
|} | |} | ||
Latest revision as of 08:54, 20 September 2017
Confirguration

| Settings | Description | Values |
|---|---|---|
|
|
|
|
|
|
|
|
|
|
|
|
|
|
|
Note: The configuration is for the whole page
HHD Graph

| Purpose |
|
|---|---|
| Example |
|
Summary Table

| Purpose |
|
|---|
Average profiles

Purpose: Charts the average usage over a day
| Average daily profile |
|
|---|---|
| All Day Stats |
|
| Business Day Stats |
|
| Other Day Stats |
|