Difference between revisions of "Time Of Use Graph"
Jump to navigation
Jump to search
| Line 3: | Line 3: | ||
!Width="100" Align="Center"|'''Purpose ''' | !Width="100" Align="Center"|'''Purpose ''' | ||
| | | | ||
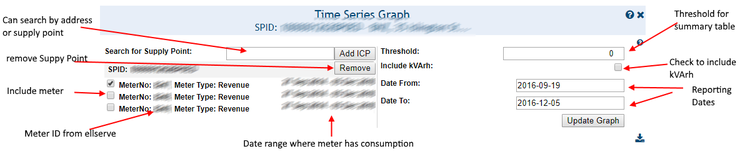
| − | :To report consumption by trading period (half hourly) | + | :To report consumption by trading period (half hourly) for the selected meters |
|- | |- | ||
!'''Example ''' | !'''Example ''' | ||
Revision as of 16:53, 19 September 2017
Configuration
| Purpose |
|
|---|---|
| Example |
|


| Settings | Description | Values |
|---|---|---|
|
| |
|
|
|
|
||
|
|

| Settings | Description | Values |
|---|---|---|
|
| |
|
|
|
|
||
|
|

| Settings | Description | Values |
|---|---|---|
|
| |
|
|
|
|
||
|
|