Difference between revisions of "Time Of Use Graph"
Jump to navigation
Jump to search
| Line 1: | Line 1: | ||
==Configuration== | ==Configuration== | ||
| − | |||
{| class="wikitable" style="text-align: left; color: black;" | {| class="wikitable" style="text-align: left; color: black;" | ||
!Width="100" Align="Center"|'''Purpose ''' | !Width="100" Align="Center"|'''Purpose ''' | ||
| | | | ||
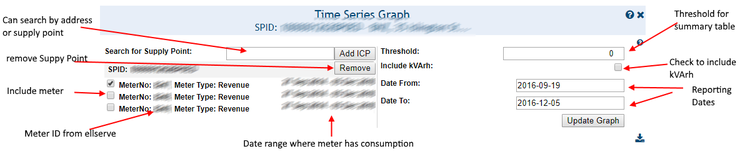
| − | :To report | + | :To report consumption by trading period (half hourly) |
|- | |- | ||
!'''Example ''' | !'''Example ''' | ||
| Line 10: | Line 9: | ||
:To compare actual versus projected cost, consumption and emissions data by month for an individual or any predefined grouping of accounts or ICPs. | :To compare actual versus projected cost, consumption and emissions data by month for an individual or any predefined grouping of accounts or ICPs. | ||
|} | |} | ||
| + | |||
| + | [[File:TOU1.PNG|right|750px|Frame|Data Table Configuration Panel]] | ||
| + | |||
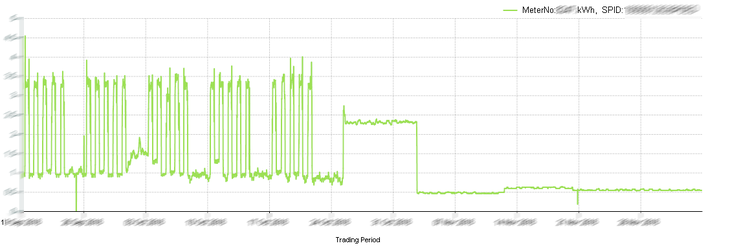
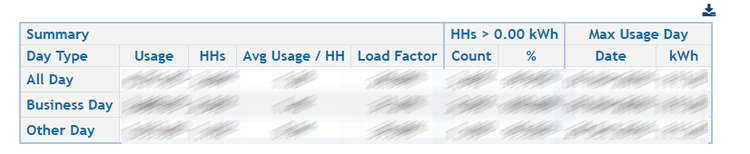
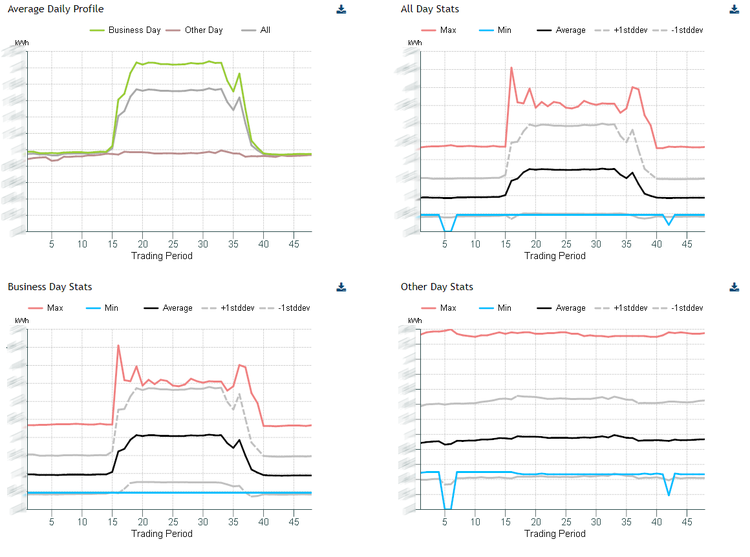
[[File:TOU2.PNG|right|750px|Frame|Data Table Display]] | [[File:TOU2.PNG|right|750px|Frame|Data Table Display]] | ||
{|class="wikitable" style="text-align: left; color: black;" | {|class="wikitable" style="text-align: left; color: black;" | ||
Revision as of 16:53, 19 September 2017
Configuration
| Purpose |
|
|---|---|
| Example |
|


| Settings | Description | Values |
|---|---|---|
|
| |
|
|
|
|
||
|
|

| Settings | Description | Values |
|---|---|---|
|
| |
|
|
|
|
||
|
|

| Settings | Description | Values |
|---|---|---|
|
| |
|
|
|
|
||
|
|