Difference between revisions of "Time Of Use Graph"
Jump to navigation
Jump to search
| Line 1: | Line 1: | ||
==Configuration== | ==Configuration== | ||
| − | |||
| − | |||
| − | |||
| − | |||
| − | |||
| − | |||
| − | |||
| − | |||
| − | |||
| − | |||
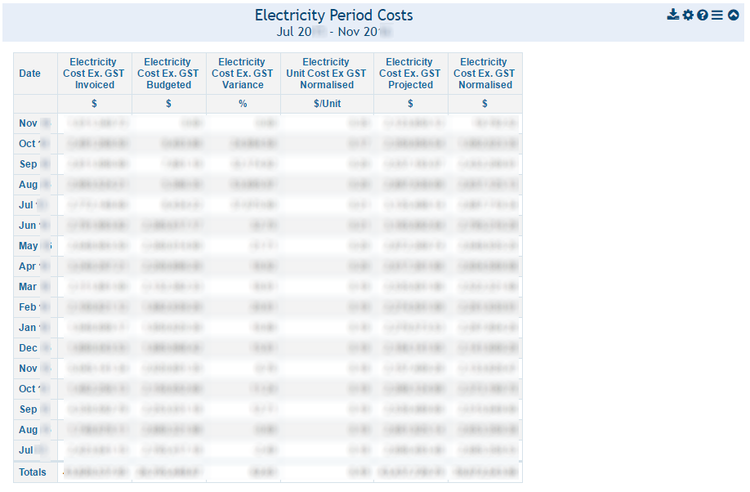
[[File:Table2.png|right|750px|Frame|Data Table Display]] | [[File:Table2.png|right|750px|Frame|Data Table Display]] | ||
{|class="wikitable" style="text-align: left; color: black;" | {|class="wikitable" style="text-align: left; color: black;" | ||
Revision as of 16:41, 6 August 2014
Configuration

| Settings | Description | Values |
|---|---|---|
|
| |
|
|
|
|
||
|
|
Usage
The data table has no interactive usage features.